Python 3.15 버전에서 추가된 샘플링 프로파일러 사용해 보기
Python 3.15 버전부터 업데이트된 샘플링 프로파일러의 기능과 동작 방식에 대한 포스팅입니다.
📌 Overview
최근 들어 서비스 개발을 할 때에는 기능 구현보다 설계와 성능에 투자하는 시간이 늘어나고 있는 거 같다. 단순 기능 구현은 AI가 작성해주는 다양한 코드 중에서 입맛에 맞게 선택하고 적용하면 되기 때문에, 그만큼 확보하는 시간을 설계 방식이나 성능 최적화를 고민하는 데에 할애할 수 있다. 이렇듯 서비스의 완성도와 직결되는 이점이 AI의 순기능이 아닐까 싶다.
그렇다면 설계에 문제는 없는지, 성능에 대한 최적화는 필요하지 않은지를 판단할 수 있는 방법은 무엇일까? 가장 정확한 방법은 프로파일링(Profiling) 기법을 사용하는 것이다.
이번 포스팅에서는 Python 3.15 부터 추가되는 샘플링 프로파일링을 어떻게 활용하는지, cProfile 등 기존 결정론적 프로파일링 도구들과 비교했을 때 구체적으로 어떤 점들이 개선되었는지를 기록한다.
📌 프로파일링이란?
프로파일링(Profiling)은 프로파일러(Profiler)라는 도구를 사용하여 소스 코드나 바이너리 파일을 계측 분석하는 기법이다. 프로그램의 시간/메모리 복잡도나 특정 함수의 호출 주기 및 빈도를 측정할 수 있다. 이를 통해 프로그램의 실행 시간, CPU 사용량, 메모리 소비량 등의 세부 사항을 파악하여 병목 구간을 발굴하고 로직을 최적화한다.
- 성능 병목 현상 파악: 프로그램에서 CPU 시간, 메모리, I/O 등 특정 리소스를 과도하게 사용하는 부분을 찾아낸다. 어떤 함수가 실행 시간의 대부분을 차지하는지, 어떤 코드가 메모리 누수를 발생시키는지 등을 분석할 수 있다.
- 리소스 사용량 최적화: 프로그램이 어떤 리소스를 얼마나 사용하는지 측정하여 불필요한 리소스 사용을 줄이고 효율성을 높이는 방법을 모색한다.
- 코드 개선점 발굴: 특정 코드 블록이나 함수의 실행 빈도, 호출 시간 등을 분석하여 성능 개선이 필요한 부분을 발굴한다.
📌 cProfile을 이용한 프로파일링
Python 3.15 이전까지는 내장 모듈인 cProfile을 이용하여 프로파일링하는 것이 일반적이었다. cProfile은 결정론적 프로파일링(Deterministic Profiling) 방식으로 작동한다. 결정론적 프로파일링 기법은 프로그램이 실행되는 동안 모든 함수 호출, 함수 반환, 예외 발생 등 주요 이벤트를 하나도 놓치지 않고 추적하여 상세한 통계를 기록하는데, 함수 자체의 실행 시간인 tottime과 함수가 호출된 시점부터 종료될 때까지 걸린 전체 시간인 cumtime 두 가지를 핵심 항목으로 사용한다.
✨ cProfile 사용해 보기
우선 프로파일링 대상 코드를 살펴보자. HTTP GET으로 아이템 ID를 입력받아 해당하는 아이템 정보를 반환하는 간단한 API이다.
# main.py
@app.get("/items/{item_id}", response_model=ResponseModel)
async def get_info(item_id: str) -> Dict[str, str]:

    # 아이템 정보 조회를 위한 API 호출
    result = await get_data_from_api(item_id)

    if result is None:
        raise HTTPException(status_code=400, detail="조회 실패")

    return {"result": result, "message": "성공"}
위 코드에서 get_data_from_api 함수 호출이 병목 구간으로 의심될 경우, 해당 함수의 순수 실행 시간을 알아내고자 프로파일링을 해볼 수 있다. 함수 내부에서 어떤 또 다른 함수를 호출하는지, 그 함수의 처리 시간은 얼마나 소요되었는가로 정확한 병목 구간을 파악할 수 있는 것이다.
이제 cProfile 모듈로 get_data_from_api 함수를 프로파일링하기 위한 코드를 작성해 보자.
cProfile모듈은 비동기 함수의 프로파일링을 지원하지 않는다. 따라서 프로파일링 대상인 비동기 함수get_data_from_api를 호출하기 위한 래퍼(Wrapper) 함수로run_async_profiling를 생성해 주었다.
# profiling.py
from src.database.db import get_data_from_api
from cProfile import Profile
from pstats import Stats
import asyncio

profiler = Profile()

def run_async_profiling():
    asyncio.run(get_data_from_api("test"))

profiler.runcall(run_async_profiling)


# 프로파일링 결과 통계
# cumtime으로 정렬
stats = Stats(profiler)
stats.strip_dirs()
stats.sort_stats(cumtime)
stats.print_stats()
python profiling.py으로 실행해 보면 총 몇 개의 함수가 몇 초 동안 호출되었는지를 파악할 수 있다.
    551 function calls (549 primitive calls) in 0.001 seconds

    Ordered by: cumulative time

   ncalls  tottime  percall  cumtime  percall filename:lineno(function)
        1    0.000    0.000    0.001    0.001 profiling.py:8(run_async_profiling)
        1    0.000    0.000    0.001    0.001 runners.py:160(run)
        1    0.000    0.000    0.000    0.000 runners.py:58(__enter__)
        2    0.000    0.000    0.000    0.000 runners.py:131(_lazy_init)
        1    0.000    0.000    0.000    0.000 events.py:808(new_event_loop)
        1    0.000    0.000    0.000    0.000 events.py:693(new_event_loop)
        1    0.000    0.000    0.000    0.000 windows_events.py:312(__init__)
        1    0.000    0.000    0.000    0.000 proactor_events.py:631(__init__)
        3    0.000    0.000    0.000    0.000 base_events.py:618(run_until_complete)
        3    0.000    0.000    0.000    0.000 windows_events.py:317(run_forever)
        1    0.000    0.000    0.000    0.000 proactor_events.py:782(_make_self_pipe)
        1    0.000    0.000    0.000    0.000 socket.py:616(socketpair)
        1    0.000    0.000    0.000    0.000 runners.py:86(run)
    ...
stats.sort_stats()로 정렬 기준도 설정할 수 있다.
calls(ncalls): 함수 호출 횟수tottime(time): 함수 자체의 실행 시간 (하위 함수 제외)cumtime: 함수와 그 하위 함수를 포함한 누적 실행 시간pcalls: 기본 호출 횟수 (재귀 호출 포함)filename: 파일 이름line: 라인 번호name: 함수 이름
✨ Delay가 발생하는 함수 프로파일링 해보기
이번에는 함수의 부하를 가정하고 함수를 return 하기 전 지연을 설정해 보았다.
# db.py
import asyncio
import random

async def get_data_from_api(item_id: str) -> dict:
    # 0.5 ~ 0.9초 사이의 지연 발생
    await asyncio.sleep(round(random.uniform(0.5, 0.9), 4))

    """
    DB 쿼리 생략
    """
    return {"item_id": item_id, "data": "Test Data"}
profiling.py를 다시 실행해 보면 profiling.py:8(run_async_profiling)의 처리 시간이 증가한 것을 확인할 수 있다.
    617 function calls (615 primitive calls) in 0.850 seconds

    Ordered by: cumulative time

   ncalls  tottime  percall  cumtime  percall filename:lineno(function)
        1    0.000    0.000    0.850    0.850 profiling.py:8(run_async_profiling)
        1    0.000    0.000    0.850    0.850 runners.py:160(run)
        3    0.000    0.000    0.849    0.283 base_events.py:618(run_until_complete)
        3    0.000    0.000    0.848    0.283 windows_events.py:317(run_forever)
        3    0.000    0.000    0.848    0.283 base_events.py:594(run_forever)
        8    0.000    0.000    0.848    0.106 base_events.py:1859(_run_once)
        1    0.000    0.000    0.847    0.847 runners.py:86(run)
        9    0.000    0.000    0.847    0.094 windows_events.py:812(_poll)
        8    0.000    0.000    0.847    0.106 windows_events.py:442(select)
       12    0.846    0.071    0.846    0.071 {built-in method _overlapped.GetQueuedCompletionStatus}
        1    0.000    0.000    0.002    0.002 runners.py:62(__exit__)
        1    0.000    0.000    0.002    0.002 runners.py:65(close)
       13    0.000    0.000    0.001    0.000 events.py:82(_run)
    ...
✨ cProfile의 단점
하지만 cProfile과 같은 결정론적 프로파일링 방식은 근본적으로 단점이 존재한다. 프로그램의 실행 과정에 후크(hook)를 걸어 각 함수가 호출되거나 반환될 때마다 데이터를 기록하기 때문에 실행 내용 모두를 정확하게 파악할 수 있다는 장점이 있지만 오버헤드가 높고 실제 프로덕션 서비스에 적용하기 어렵다.
모든 함수 호출을 추적하는 과정 자체가 많은 리소스를 소모하기 때문에 호출 빈도가 높은 함수에서는 성능 저하가 발생할 수 있다. 따라서 프로덕션 환경에서만 발생하는 성능 이슈를 파악하기 위해 적용하는 것은 적합하지 않다.
📌 Python 3.15의 샘플링 프로파일링
Python 3.15부터 PEP 799를 통해 profiling.sampling이 새롭게 추가되었다. 공식 문서에서는 High frequency statistical sampling profiler 즉 고주파 통계 샘플링 프로파일러로 소개되었다.
High frequency statistical sampling profiler(공식 문서 발췌)
A new statistical sampling profiler (Tachyon) has been added as profiling.sampling. This profiler enables low-overhead performance analysis of running Python processes without requiring code modification or process restart.
Unlike deterministic profilers (such as profiling.tracing) that instrument every function call, the sampling profiler periodically captures stack traces from running processes. This approach provides virtually zero overhead while achieving sampling rates of up to 1,000,000 Hz, making it the fastest sampling profiler available for Python (at the time of its contribution) and ideal for debugging performance issues in production environments. This capability is particularly valuable for debugging performance issues in production systems where traditional profiling approaches would be too intrusive.
기존에 사용되던 결정론적 프로파일러인 profile, cProfile과 달리 profiling.sampling은 실행되는 프로세스에서 주기적으로 모든 함수 호출의 스택 추적을 캡처한다. 이러한 접근 방식은 오버헤드가 거의 없는 동시에 최대 1,000,000Hz의 샘플링 속도로 현재까지 Python에서 가장 빠른 샘플링 프로파일러 기법이라고 한다. profiling.sampling의 특징은 다음과 같다.
- 저비용: 실행 속도에 거의 영향을 주지 않아 프로덕션 환경에서도 사용하기 적합
- 통계적 접근: 모든 호출을 기록하지 않고 주기적으로 스냅샷을 찍어 병목 구간 등을 파악
- 사용법 (CLI): 코드를 수정할 필요 없이 터미널에서 모듈을 실행하는 방식
정리해보면, profiling.sampling은 프로그램 실행에 직접적인 관여를 하지 않는 방식이다. 이유는 프로그램의 실행 속도에 영향을 주지 않기 위해서일 것이다. 이러한 개념이 기존 Python의 프로파일러 모듈 cProfile과 차별점이라 생각된다.
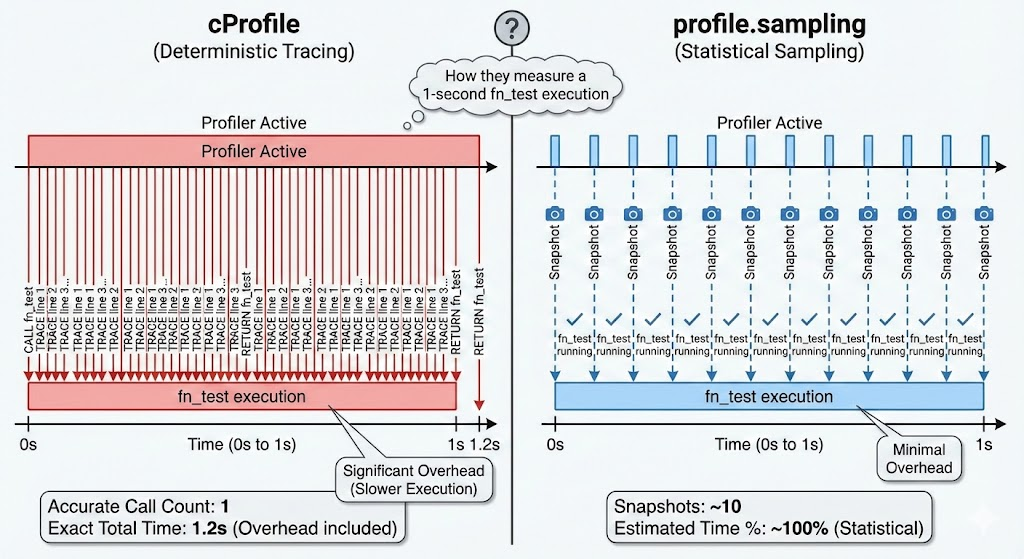
실행 시간이 1,000ms인 함수가 있을 때,
cProfile은 그 함수에 직접적으로 관여하여 실행 시간과 리소스를 측정한다.- 반면
profiling.sampling은 함수에 직접적인 관여를 하지 않고, 함수의 실행 중인 상태를 주기적인 스냅샷을 통해 측정한다. - 고주파의 의미는 샘플링 주기, 즉 스냅샷의 주기가 엄청나게 짧다는 것이다.
- 1,000,000Hz라는 수치는 초당 최대 100만번의 스냅샷을 찍을 수 있다는 의미이다. 다만 실제로는 Python 코드가 실행 중일 때만 스냅샷이 포착되므로, I/O 대기 구간에서는 miss rate가 높게 나타난다.
이제 직접 사용해 보도록 하자
✨ Python 3.15 설치 및 환경변수 설정
우선 Python 3.15를 설치해준다. 샘플링 프로파일러는 코드에 박아서 실행할 수도 있지만 보통 CLI에서 실행 중인 프로세스에 PID를 붙이는 방식으로 호출한다. 따라서 환경 변수까지 등록하고 --version으로 등록을 확인해주는 것이 좋다. 
✨ 샘플링 프로파일러 호출
시험 대상은 CPU/메모리 부하 발생 엔드포인트가 있는 HTTP 서버이다.
import hashlib
import json
import logging
import os
import sys
import threading
import time
from concurrent.futures import ThreadPoolExecutor
from http.server import BaseHTTPRequestHandler, HTTPServer
from urllib.parse import parse_qs, urlparse

logging.basicConfig(
    level=logging.INFO,
    format="%(asctime)s | %(levelname)-8s | %(message)s",
    datefmt="%Y-%m-%d %H:%M:%S",
)
logger = logging.getLogger(__name__)


def cpu_burn(duration_ms: int) -> int:
    """SHA-256 루프로 CPU 부하 발생. 실제 반복 횟수 반환."""
    deadline = time.perf_counter() + duration_ms / 1000
    iterations = 0
    data = os.urandom(4096)
    while time.perf_counter() < deadline:
        data = hashlib.sha256(data).digest() * 16
        iterations += 1
    return iterations


def alloc_memory(size_mb: int) -> int:
    """size_mb 만큼 메모리 할당 후 해제. 실제 할당 바이트 반환."""
    chunk = bytearray(size_mb * 1024 * 1024)
    for i in range(0, len(chunk), 4096):
        chunk[i] = i & 0xFF
    allocated = len(chunk)
    del chunk
    return allocated


def run_load(cpu_ms: int, memory_mb: int) -> dict:
    t0 = time.perf_counter()
    iterations = cpu_burn(cpu_ms)
    allocated = alloc_memory(memory_mb)
    elapsed_ms = (time.perf_counter() - t0) * 1000
    return {
        "cpu_ms_requested": cpu_ms,
        "cpu_iterations": iterations,
        "memory_allocated_bytes": allocated,
        "elapsed_ms": round(elapsed_ms, 2),
    }


_executor = ThreadPoolExecutor(max_workers=16)


class Handler(BaseHTTPRequestHandler):

    def log_message(self, fmt, *args):
        logger.info("%-20s %s", self.address_string(), fmt % args)

    def _send_json(self, status: int, body: dict):
        payload = json.dumps(body, indent=2).encode()
        self.send_response(status)
        self.send_header("Content-Type", "application/json")
        self.send_header("Content-Length", str(len(payload)))
        self.end_headers()
        self.wfile.write(payload)

    def _query(self, key: str, default: int) -> int:
        qs = parse_qs(urlparse(self.path).query)
        try:
            return int(qs.get(key, [default])[0])
        except (ValueError, IndexError):
            return default

    def do_GET(self):
        path = urlparse(self.path).path

        if path == "/health":
            self._send_json(200, {
                "status": "ok",
                "python": sys.version,
                "pid": os.getpid(),
            })

        else:
            self._send_json(404, {"detail": "Not found"})

    def do_POST(self):
        path = urlparse(self.path).path

        # ── /process : 단일 부하 ─────────────────────────────────────────────
        if path == "/process":
            cpu_ms    = max(0, min(self._query("cpu_ms", 500),   10_000))
            memory_mb = max(0, min(self._query("memory_mb", 64),    512))

            result = run_load(cpu_ms, memory_mb)
            self._send_json(202, {"status": "processed", **result})

        # ── /stress : 동시 부하 (concurrency 개 스레드) ──────────────────────
        elif path == "/stress":
            cpu_ms      = max(0, min(self._query("cpu_ms", 1000),  10_000))
            memory_mb   = max(0, min(self._query("memory_mb", 64),    512))
            concurrency = max(1, min(self._query("concurrency", 4),     32))

            futures = [
                _executor.submit(run_load, cpu_ms, memory_mb)
                for _ in range(concurrency)
            ]
            results = [f.result() for f in futures]

            self._send_json(202, {
                "status": "stress_complete",
                "concurrency": concurrency,
                "workers": results,
            })

        else:
            self._send_json(404, {"detail": "Not found"})


def main():
    host = "0.0.0.0"
    port = 8000
    server = HTTPServer((host, port), Handler)

    logger.info("[STARTUP] Python %s", sys.version)
    logger.info("[STARTUP] PID %d", os.getpid())
    logger.info("[STARTUP] Listening on http://%s:%d", host, port)
    logger.info("[STARTUP] Endpoints: GET /health  POST /process  POST /stress")

    try:
        server.serve_forever()
    except KeyboardInterrupt:
        logger.info("[SHUTDOWN] Interrupted, stopping ...")
        server.shutdown()


if __name__ == "__main__":
    main()
서버를 구동하면 아래와 같이 PID가 출력되는데 해당 PID로 샘플링 프로파일러를 호출해보자
2025-11-20 12:58:36 | INFO | [STARTUP] PID 36280
호출 구문
python -m profiling.sampling --pid 36280 --duration 10
🌊 부하 미발생 상태
서버가 스타트 이후 요청이 없는 상태에서 호출했을 경우 아래와 같이 출력된다. 샘플링된 수치는 없지만 miss rate가 97.57%로 측정되었다. miss rate는 파이썬 코드가 얼마나 바쁜가의 반비례 지표라고 할 수 있다. 샘플링 프로파일러는 파이썬 코드가 실행 중일 때만 스냅샷을 찍을 수 있는데, 유휴 상태에서 CPU는 파이썬 코드가 아닌 OS 커널을 실행 중이기 때문에 프로파일러가 스냅샷을 찍으려 해도 파이썬 스택이 존재하지 않는다.
Captured 2432 samples in 10.00 seconds
Sample rate: 243.19 samples/sec
Error rate: 0.00%
Warning: missed 97568 samples from the expected total of 100000 (97.57%)
Profile Stats:
       nsamples   sample%  tottime (ms)    cumul%  cumtime (ms)  filename:lineno(function)
      2432/2432     100.0       243.200     100.0       243.200  selectors.py:305(SelectSelector._select)
         0/2432       0.0         0.000     100.0       243.200  selectors.py:314(SelectSelector.select)
         0/2432       0.0         0.000     100.0       243.200  socketserver.py:232(BaseServer.serve_forever)
         0/2432       0.0         0.000     100.0       243.200  profiler_target.py:135(main)
         0/2432       0.0         0.000     100.0       243.200  profiler_target.py:142(<module>)

Legend:
  nsamples: Direct/Cumulative samples (direct executing / on call stack)
  sample%: Percentage of total samples this function was directly executing
  tottime: Estimated total time spent directly in this function
  cumul%: Percentage of total samples when this function was on the call stack
  cumtime: Estimated cumulative time (including time in called functions)
  filename:lineno(function): Function location and name

Summary of Interesting Functions:

Functions with Highest Direct/Cumulative Ratio (Hot Spots):
  1.000 direct/cumulative ratio, 100.0% direct samples: selectors.py:(SelectSelector._select)

Functions with Highest Call Frequency (Indirect Calls):
  2432 indirect calls, 100.0% total stack presence: selectors.py:(SelectSelector.select)
  2432 indirect calls, 100.0% total stack presence: socketserver.py:(BaseServer.serve_forever)
  2432 indirect calls, 100.0% total stack presence: profiler_target.py:(main)

Functions with Highest Call Magnification (Cumulative/Direct):
🌊 CPU + 메모리 부하 발생 상태
이번에는 /process API가 호출되어 CPU와 메모리에 부하가 발생한 상태에서 프로파일링을 시도해 보았다. 그 결과 병목이 포착되었고, 10초 중 70.2%가 cpu_burn에서 소비되었다는 것을 알 수 있었다.
- 1552/1552 70.2% profiler_target.py:26(cpu_burn) ← 핵심 병목
- 477/ 477 21.6% selectors.py(SelectSelector._select) ← I/O 대기
콜스택으로 요청 흐름을 추적해보면 run_load의 direct sample은 0%인데 cpu_burn이 70.2%라는 것은 run_load 자체는 그냥 호출만 하고, 실제 CPU는 cpu_burn에서 처리한다는 의미이다.
-
→ main() - → serve_forever() → _handle_request_noblock()
- → process_request() → finish_request()
- → Handler.do_POST() ← 78.4% 스택 점유
- → run_load() ← 77.7%
- → cpu_burn() ← 70.2% 직접 실행
이전 시험과 비교하면 miss rate는 비슷하지만 _select 비중이 100% → 21.6%로 줄었다. 나머지 78.4%가 cpu_burn과 요청 처리로 채워진 것이고, miss rate가 여전히 높은 건 10,000Hz 목표치가 매우 높기 때문일 것이다.
Captured 2214 samples in 10.00 seconds
Sample rate: 221.30 samples/sec
Error rate: 0.18%
Warning: missed 97786 samples from the expected total of 100000 (97.79%)
Profile Stats:
       nsamples   sample%  tottime (ms)    cumul%  cumtime (ms)  filename:lineno(function)
         0/2210       0.0         0.000     100.0       221.000  profiler_target.py:135(main)
         0/2210       0.0         0.000     100.0       221.000  profiler_target.py:142(<module>)
         0/1733       0.0         0.000      78.4       173.300  profiler_target.py:99(Handler.do_POST)
         0/1733       0.0         0.000      78.4       173.300  server.py:458(BaseHTTPRequestHandler.handle_one_request)
         0/1733       0.0         0.000      78.4       173.300  server.py:470(BaseHTTPRequestHandler.handle)
         0/1733       0.0         0.000      78.4       173.300  socketserver.py:763(BaseRequestHandler.__init__)
         0/1733       0.0         0.000      78.4       173.300  __init__:0(__init__)
         0/1733       0.0         0.000      78.4       173.300  socketserver.py:359(BaseServer.finish_request)
         0/1733       0.0         0.000      78.4       173.300  socketserver.py:346(BaseServer.process_request)
         0/1733       0.0         0.000      78.4       173.300  socketserver.py:315(BaseServer._handle_request_noblock)
         0/1733       0.0         0.000      78.4       173.300  socketserver.py:237(BaseServer.serve_forever)
         0/1718       0.0         0.000      77.7       171.800  profiler_target.py:43(run_load)
      1552/1552      70.2       155.200      70.2       155.200  profiler_target.py:26(cpu_burn)
        477/477      21.6        47.700      21.6        47.700  selectors.py:305(SelectSelector._select)
          0/477       0.0         0.000      21.6        47.700  selectors.py:314(SelectSelector.select)

Legend:
  nsamples: Direct/Cumulative samples (direct executing / on call stack)
  sample%: Percentage of total samples this function was directly executing
  tottime: Estimated total time spent directly in this function
  cumul%: Percentage of total samples when this function was on the call stack
  cumtime: Estimated cumulative time (including time in called functions)
  filename:lineno(function): Function location and name

Summary of Interesting Functions:

Functions with Highest Direct/Cumulative Ratio (Hot Spots):
  1.000 direct/cumulative ratio, 70.2% direct samples: profiler_target.py:(cpu_burn)
  1.000 direct/cumulative ratio, 21.6% direct samples: selectors.py:(SelectSelector._select)

Functions with Highest Call Frequency (Indirect Calls):
  2210 indirect calls, 100.0% total stack presence: profiler_target.py:(main)
  2210 indirect calls, 100.0% total stack presence: profiler_target.py:(<module>)
  1733 indirect calls, 78.4% total stack presence: profiler_target.py:(Handler.do_POST)

Functions with Highest Call Magnification (Cumulative/Direct):
🌊 멀티스레드 동시 부하 발생 상태
이번에는 /stress API가 호출되어 멀티스레드 부하가 발생한 상태에서 프로파일링을 시도해 보았다. 이전 시험과 달리 스레드가 대기 중 상태로 전환되었다.
- (/stress): Condition.wait 76.6% ← 스레드 대기 중
Condition.wait의 수치가 76.6%로 출력되었다. 핸들러 스레드는 f.result()로 워커들이 끝날 때까지 블로킹 대기 중이다. 실제 cpu_burn 작업은 ThreadPoolExecutor 워커 스레드에서 돌아가고 있는데, 그 스레드들은 샘플에 잡히지 않는 거 같다.
- → _executor.submit(run_load, …) # 워커 스레드에 작업 위임
- → f.result() # 결과 대기
- → Future.result()
- → Condition.wait() ← 76.6% 여기서 블로킹
샘플링 프로파일러가 메인/핸들러 스레드 위주로 샘플링하고 있어서, ThreadPoolExecutor 워커 스레드에서 실제 CPU를 태우는 cpu_burn이 보이지 않는다. 멀티스레드 환경에서는 작업을 위임한 스레드가 아니라 실제 작업 스레드를 별도로 프로파일링하거나, 단일 스레드 엔드포인트(/process)로 측정하는 게 더 정확할 것이다.
Captured 2179 samples in 10.00 seconds
Sample rate: 217.87 samples/sec
Error rate: 0.18%
Warning: missed 97821 samples from the expected total of 100000 (97.82%)
Profile Stats:
       nsamples   sample%  tottime (ms)    cumul%  cumtime (ms)  filename:lineno(function)
         0/2175       0.0         0.000     100.0       217.500  profiler_target.py:135(main)
         0/2175       0.0         0.000     100.0       217.500  profiler_target.py:142(<module>)
         0/1670       0.0         0.000      76.8       167.000  server.py:470(BaseHTTPRequestHandler.handle)
         0/1670       0.0         0.000      76.8       167.000  socketserver.py:763(BaseRequestHandler.__init__)
         0/1670       0.0         0.000      76.8       167.000  __init__:0(__init__)
         0/1670       0.0         0.000      76.8       167.000  socketserver.py:359(BaseServer.finish_request)
         0/1670       0.0         0.000      76.8       167.000  socketserver.py:346(BaseServer.process_request)
         0/1670       0.0         0.000      76.8       167.000  socketserver.py:315(BaseServer._handle_request_noblock)
         0/1670       0.0         0.000      76.8       167.000  socketserver.py:237(BaseServer.serve_forever)
         1/1668       0.0         0.100      76.7       166.800  profiler_target.py:112(Handler.do_POST)
         0/1668       0.0         0.000      76.7       166.800  server.py:458(BaseHTTPRequestHandler.handle_one_request)
      1667/1667      76.6       166.700      76.6       166.700  threading.py:362(Condition.wait)
         0/1667       0.0         0.000      76.6       166.700  _base.py:445(Future.result)
        505/505      23.2        50.500      23.2        50.500  selectors.py:305(SelectSelector._select)
          0/505       0.0         0.000      23.2        50.500  selectors.py:314(SelectSelector.select)

Legend:
  nsamples: Direct/Cumulative samples (direct executing / on call stack)
  sample%: Percentage of total samples this function was directly executing
  tottime: Estimated total time spent directly in this function
  cumul%: Percentage of total samples when this function was on the call stack
  cumtime: Estimated cumulative time (including time in called functions)
  filename:lineno(function): Function location and name

Summary of Interesting Functions:

Functions with Highest Direct/Cumulative Ratio (Hot Spots):
  1.000 direct/cumulative ratio, 76.6% direct samples: threading.py:(Condition.wait)
  1.000 direct/cumulative ratio, 23.2% direct samples: selectors.py:(SelectSelector._select)
  0.001 direct/cumulative ratio, 0.0% direct samples: profiler_target.py:(Handler.do_POST)

Functions with Highest Call Frequency (Indirect Calls):
  2175 indirect calls, 100.0% total stack presence: profiler_target.py:(main)
  2175 indirect calls, 100.0% total stack presence: profiler_target.py:(<module>)
  1670 indirect calls, 76.8% total stack presence: server.py:(BaseHTTPRequestHandler.handle)

Functions with Highest Call Magnification (Cumulative/Direct):
  1668.0x call magnification, 1667 indirect calls from 1 direct: profiler_target.py:(Handler.do_POST)
✨ 파이썬 프로세스가 아닌 경우
샘플링 프로파일러는 PID로 붙는다. 그렇다면 파이썬으로 개발된 프로세스 뿐만 아니라 모든 프로세스에 붙을 수 있지 않을까? 결론부터 말하자면 불가하다. PID로 붙는 건 맞지만 파이썬 프로세스 전용이다. 이게 무슨 얘기냐. 스택 트레이스를 캡처할 때 파이썬 내부 구조체를 직접 읽는다.
- PID로 해당 프로세스 메모리 접근
- PyFrameObject 탐색 (파이썬 내부 프레임 구조체)
- 현재 실행 중인 .py 파일명, 함수명, 코드 라인 추출
이러한 절차로 캡처되는데 파이썬이 아니면 PyFrameObject가 메모리에 없어 읽는 것이 불가하다.
파이썬이 아닌 프로세스에 시도해보면 아래와 같이 PyRuntime 섹션을 못 찾아서 즉시 종료된다.
RuntimeError: Failed to find the PyRuntime section in process 25400 on Windows platform
윈도우의 VTune, ETW나 리눅스의 perf, dtrace 등 프로세스 종류를 가리지 않는 범용 프로파일러는 OS 레벨의 도구이기 때문에 언어에 국한되지 않는다. 네이티브 스택 추적이라 파이썬이든 자바든 상관없지만, 반대로 .py 파일명, 함수명, 코드 라인 추출이 불가하다.
✨ 프로파일링 타겟이 샘플링 프로파일러 버전과 다른 경우
처음에는 프로파일링 타겟을 기존에 개발 중이던 파이썬 Fast API 서비스에 붙이려고 했다. 그런데 시도를 해보니 아래와 같은 오류가 발생했다..
RuntimeError: Can’t attach from a pre-release Python interpreter to a process running a different Python version
찾아보니 샘플링 프로파일러가 PyFrameObject를 메모리에서 읽을 때 구조체 레이아웃이 파이썬 버전마다 다르기 때문에 버전이 다른 프로세스에는 붙을 수 없다. 3.15의 메모리 맵으로 3.12 프로세스를 읽으면 엉뚱한 주소를 읽게 된다고 한다.
나의 경우 Fast API 서버를 3.15로 업그레이드 할까 했지만 아직 3.15 버전에는 Rust 기반 wheel이 등록되지 않았고 VS Build Tools와 같은 C++ 빌드 도구를 설치해서 디펜던시를 설정할만큼 시간을 할애하고 싶지 않아서 다른 타겟을 별도로 만들게 되었다.
📌 결론
profiling.sampling은 코드를 수정하거나 프로세스를 재시작하지 않고도 실행 중인 파이썬 프로세스에 외부에서 붙어 병목을 포착할 수 있다는 점이 강점이다. 기존 cProfile처럼 모든 함수 호출에 hook을 거는 방식이 아니기 때문에 오버헤드가 거의 없고, 단일 스레드 환경에서는 CPU를 직접 소비하는 함수를 콜스택과 함께 정밀하게 추적할 수 있다. 프로덕션 서비스에서도 서비스를 중단하지 않고 성능 이슈를 진단할 수 있다는 점에서 실용적이다.
다만 몇 가지 제약도 존재한다. 파이썬 내부 구조체인 PyFrameObject를 직접 읽는 방식이기 때문에 파이썬 프로세스 전용이며, 프로파일러와 대상 프로세스의 파이썬 버전이 일치해야 한다. 또한 프로세스가 I/O 대기 상태일 때는 파이썬 코드가 실행 중이 아니므로 스냅샷을 찍지 못해 miss rate가 높아진다. ThreadPoolExecutor와 같이 작업을 워커 스레드에 위임하는 구조에서는 실제 CPU 작업이 일어나는 워커 스레드가 포착되지 않고 대기 중인 핸들러 스레드만 샘플에 잡히는 한계도 있다.
결국 트레이드 오프가 존재하지만 실행 중인 파이썬 프로세스의 병목을 진단할 때 만큼은 파이썬에 특화된 프로파일러라고 생각된다.